
Tom Brady roasted on crypto in Netflix special — ‘How did you fall for that?’
May 7, 2024
Bitcoin miner Marathon Digital to join S&P SmallCap 600, shares jump 18%
May 7, 2024Bitcoin ‘as strong as ever’ with record high 200-day moving average

Bitcoin’s 200-Day Moving Average Hits Record High
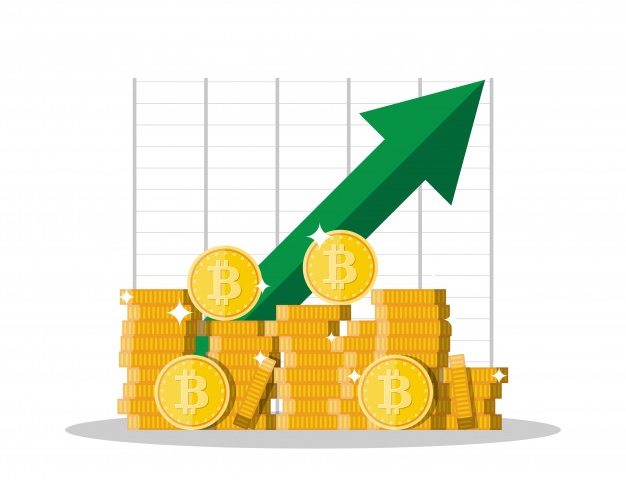
The Bitcoin 200-day moving average has reached an all-time high of $50,178, marking a significant milestone in predicting long-term Bitcoin price trends and indicating a bullish outlook.
Timing of Peak
According to BuyBitcoinWorldwide, the indicator reached its peak on May 6. This comes as Bitcoin recovers from a post-halving price dip, rebounding from as low as $56,800 after the network’s block rewards were halved to 3.125 BTC on April 20.
The 200-day simple moving average (SMA) calculates the average closing price of Bitcoin over the last 200 days, smoothing out short-term fluctuations to provide traders and analysts with a long-term trend indicator.
When Bitcoin prices trade above this indicator, as is the case currently, it typically signifies a bullish long-term trend. Conversely, prices dropping below the 200-day moving average often indicates a bearish trend.
Insights from Bitcoiner Anthony Pompliano
Bitcoin advocate Anthony Pompliano highlighted the significance of the 200-day moving average crossing $50,000 for the first time. He emphasized Bitcoin’s long-term upward trend despite day-to-day volatility and urged against complacency during periods of sideways movement.
Analyst Willy Woo’s WooCharts price models show the 200-week moving average also reaching an all-time high of over $34,000, further reinforcing the bullish long-term outlook. Additionally, the realized price (RP) indicator, standing around $29,000, aligns with the positive trend.
While the shorter-term 50-day moving average experienced a slight dip from its mid-April peak, Pompliano noted positive developments such as inflows into the Grayscale spot Bitcoin exchange-traded fund (ETF) on May 3 and April 6, after significant outflows since mid-January’s conversion to a spot ETF.

