
Bitcoin Price Analysis 13th March: BTC Recovering After Significant Decline
March 13, 2020
Bitcoin’s Capped Monetary Policy Versus Ethereum’s Minimum Necessary Issuance
March 15, 2020Bitcoin Price Analysis 14th March: BTC Eyeing Next Key Break

Bitcoin price started an upside correction after a sharp decline below $5,000. BTC/USD is currently trading near the $5,500 area and likely preparing for the next key break.
Key Findings:
- Bitcoin managed to start a decent recovery from the $3,998 swing low.
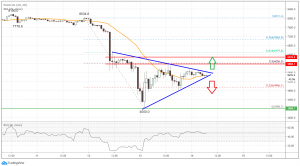
- BTC/USD is now trading inside a contracting triangle with resistance near $5,600 on the 1-hour chart.
- The price could either rally above the $5,600 resistance or it might start a fresh decline in the near term.
Bitcoin Price Analysis
Yesterday, we saw a massive decline in the bitcoin price below the $6,000 and $5,000 support levels. BTC to USD even tested the $4,000 area and traded to a new yearly low at $3,998.
Looking at the 1-hour chart, the price started an upside correction from the $3,998 low and traded above the $4,500 and $5,000 resistance levels. It even managed to climb above the $5,200 level and the 25 simple moving average (1-hour, orange).
The market data is provided by TradingView, Bitfinex.
Moreover, the bulls pushed the price above the 23.6% Fib retracement level of the recent significant decline from the $8,013 swing high to the $3,998 low.
However, the bitcoin price seems to be facing a strong resistance near the $6,000 level. Besides, the 50% Fib retracement level of the recent significant decline from the $8,013 swing high to the $3,998 low is also acting as a barrier for the bulls.
At the moment, the price is trading inside a contracting triangle with resistance near $5,600 on the same chart. If there is an upside break above the triangle resistance, the price could make an attempt to continue higher above the $5,800 and $6,000 resistance levels.
Conversely, the price might struggle to gain strength above $5,600. In the mentioned case, Bitcoin could start a fresh decline below the $5,400 and $5,200 support levels. The main support is near the $5,000 level, below which BTC is likely to decline heavily towards $4,500 or even towards the $4,000 support.


