
Crypto Market Analysis Feb 17 – Bitcoin Price, ETH, XRP.
February 17, 2020
Bitcoin Price Analysis 18 Feb: BTC Remains at Risk
February 18, 2020Bitcoin Price Analysis 17 Feb: BTC Turns Red

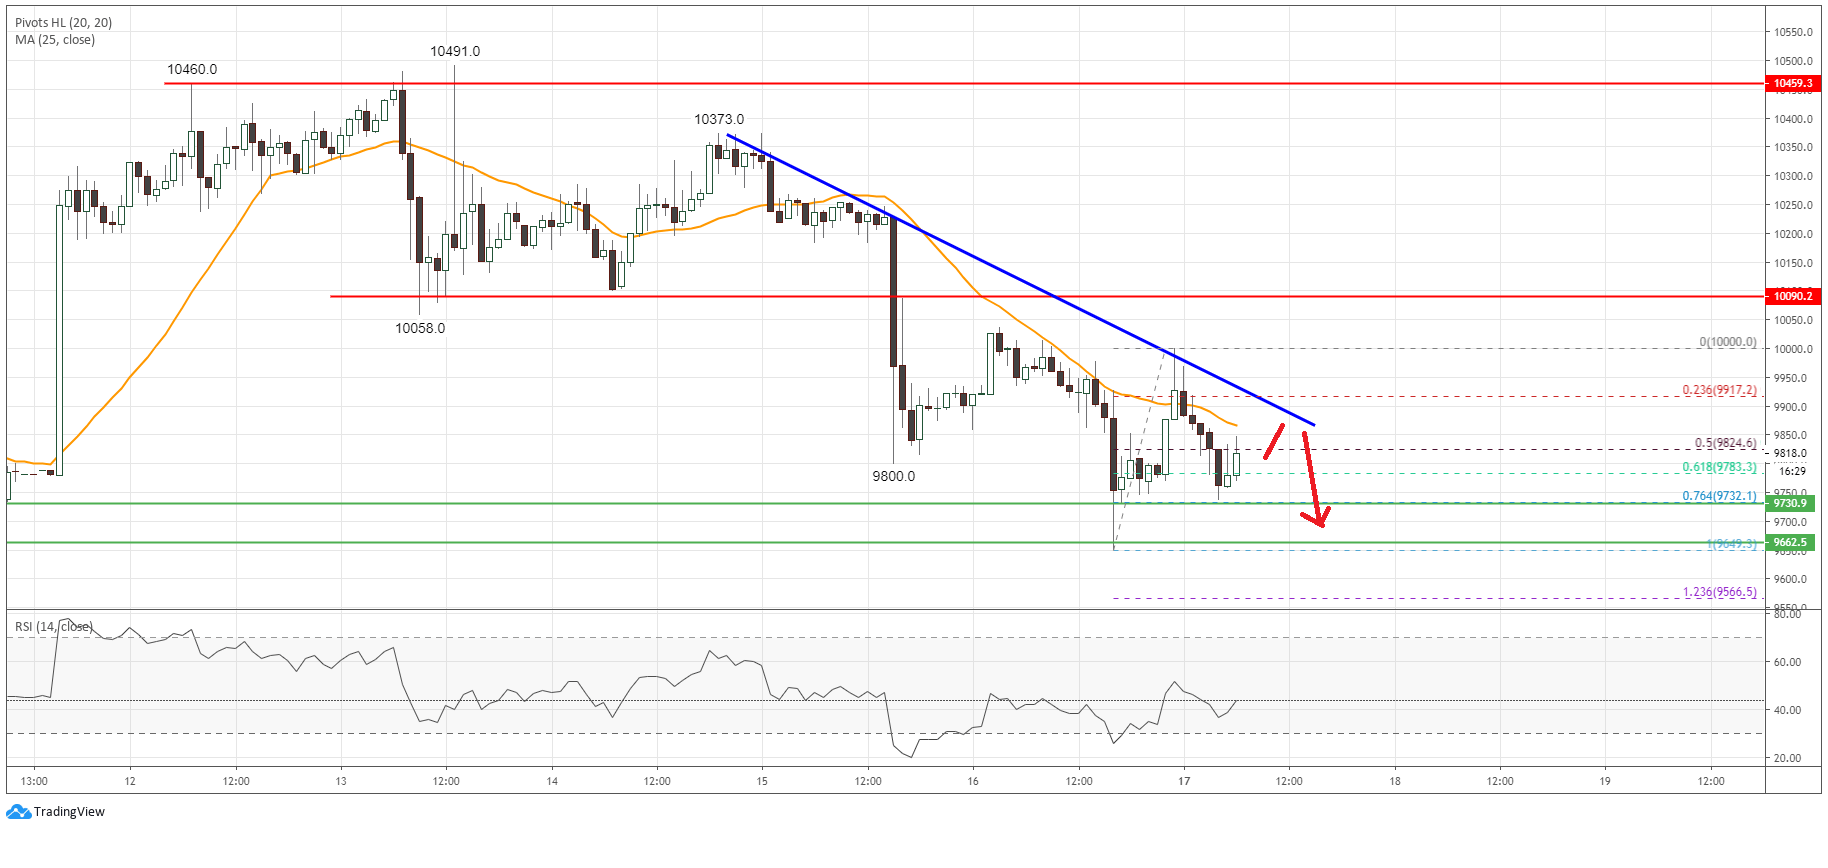
Bitcoin price declined steadily from the $10,480 resistance area. BTC/USD settled below $10,000 and it is currently consolidating losses above the $9,660 support area.
Key Findings:
- Bitcoin failed to continue above $10,480 and declined more than 5%.
- BTC/USD is following a key bearish trend line with resistance near $9,890 on the 1-hour chart.
- The price could extend its decline below the $9,660 support if it fails to recover above $10,000.
Bitcoin Price Analysis
After forming a bearish pattern near the $10,480 resistance, the bitcoin price started a steady decline against the US Dollar. BTC to USD declined below the $10,090 and $10,000 support levels to enter a bearish zone.
Looking at the 1-hour chart, the price even broke the $9,880 support area and settled below the 25 simple moving average (1-hours, orange). Finally, it spiked below $9,700 and tested the $9,660 support area.
The market data is provided by TradingView, Bitfinex.
A swing low is formed near $9,649 and the price is currently consolidating losses. It recovered above the $9,880 level, but the $10,000 area prevented more upsides.
A swing high is formed near $10,000 and the bitcoin price declined below the 50% Fib retracement level of the recent recovery from the $9,649 low to $10,000 high. More importantly, the price is following a key bearish trend line with resistance near $9,890 on the 1-hour chart.
Immediate support is near the $9,730 level. It coincides with the 76.4% Fib retracement level of the recent recovery from the $9,649 low to $10,000 high.
If there is a downside break below the $9,730 support area, there is a risk of more losses below the $9,660 support level in the near term.
On the upside, the $9,880 and $10,000 levels are important hurdles. A clear break above $10,000 could open the doors for a fresh upward move.
The next major resistance is near the $10,090 pivot level, above which Bitcoin might climb back towards the $10,460 and $10,480 resistance levels in coming sessions.


