
Crypto Market Analysis Mar 16 – Bitcoin Price, ETH/USD
March 16, 2020
Bitcoin Price Analysis 18th March: BTC Facing Key Resistance
March 18, 2020Bitcoin Price Analysis 17th March: BTC Could Dive Again

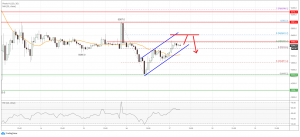
Bitcoin price started a short term upside correction after declining towards $4,450. BTC/USD is now trading above $5,200, but it is likely to face resistance near $5,620.
Key Findings:
- Bitcoin is slowly moving higher and it recently settled above the $5,000 resistance.
- BTC/USD is following a rising channel with support near $5,210 on the 1-hour chart.
- The price is likely to struggle near the $5,450 and $5,620 resistance levels.
Bitcoin Price Analysis
Yesterday, we saw a sharp decline in the bitcoin price from the $5,987 high. BTC/USD broke several key supports near the $5,000 level to start a fresh downward move.
Looking at the 1-hour chart, the price even declined below the $4,750 level and 25 simple moving average (1-hour, orange). It traded as low as $4,449 and recently started a fresh recovery wave.
The market data is provided by TradingView, Bitfinex.
There was a break above the $4,750 and $5,000 resistance levels. Moreover, the price climbed above the 50% Fib retracement level of yesterday’s slide from the $5,987 high to the $4,449 low.
At the moment, the bitcoin price is following a rising channel with support near $5,210 on the same chart. On the upside, initial resistance is near the $5,400 resistance area.
The 61.8% Fib retracement level of yesterday’s slide from the $5,987 high to the $4,449 low is also near the $5,400 resistance area. The next major resistance is near the $5,600 and $5,620 levels.
Therefore, the price may face strong selling interest near the $5,400 and $5,620 levels in coming sessions. A clear break above the $5,620 level could set the pace for a move towards resistance at $5,980.
Conversely, Bitcoin is likely to fail near the $5,400 or $5,620 resistance area. On the downside, initial support is near the channel trend line at $5,200, below which the price may perhaps test the 25 SMA. Any further losses might take bitcoin price towards the $4,750 support in the near-term.


