
Lambo or 25 BTC: What Would Be Your Pre-Halving Choice?
April 29, 2020
Bitcoin Price Analysis 2nd May: BTC Likely to Grind Higher
May 2, 2020Bitcoin Price Analysis (Weekly Chart): BTC Rally Could Extend to $10,500
Bitcoin price rallied 20% and surged above the $9,000 resistance area. BTC/USD is now testing a major hurdle at $9,500 on the weekly chart, above which it could test $10,500.
Key Findings:
- In the past few hours, the bitcoin price gained more than 20% and it broke $9,000.
- BTC/USD is now testing the $9,500 resistance and a key bullish trend line on the weekly chart.
- The pair could either correct lower from $9,500 or it might continue higher towards $10,500.
Bitcoin Price Analysis
In the past three weeks, the bitcoin price followed a strong bullish path above the $6,700 pivot level. The BTC/USD pair broke the key $7,250 resistance level to move further into a positive zone.
Looking at the weekly chart, the price gained momentum after it broke the $8,000 level and the 25 SMA (weekly, orange). Moreover, there was a clear break above the 61.8% Fib retracement level of the last major drop from $10,512 to $3,958.
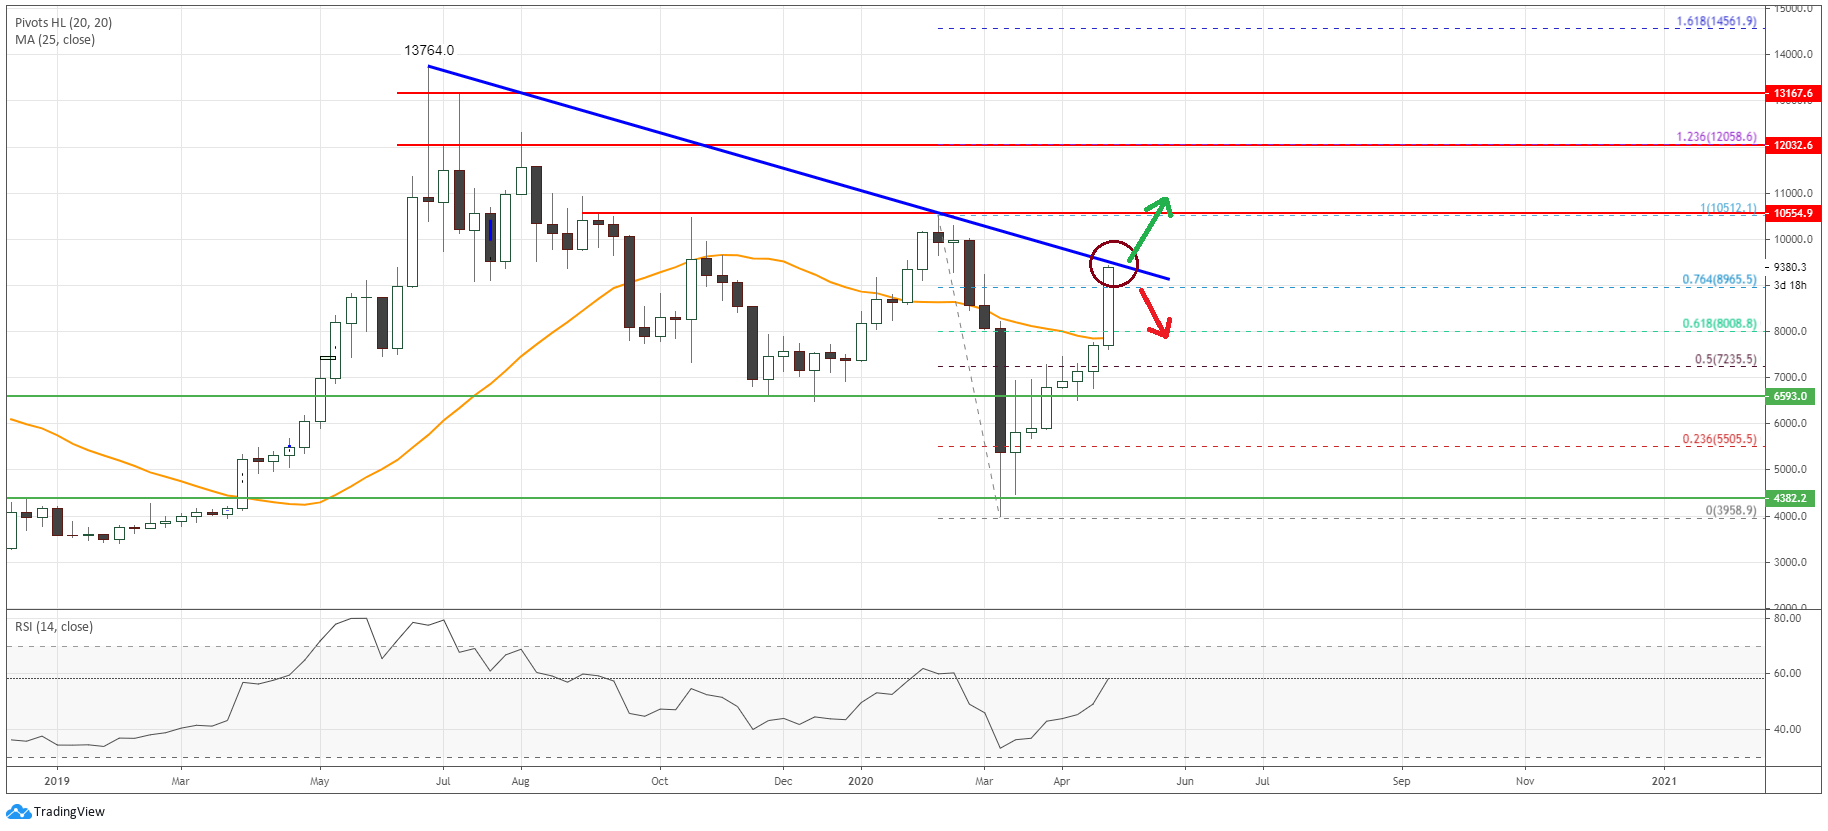
The price even jumped above the $9,000 resistance and it’s trading nicely above the 76.4% Fib retracement level of the last major drop from $10,512 to $3,958.
However, the bitcoin price is now testing the $9,500 resistance and a key bullish trend line on the same chart. If the price breaks the trend line and $9,500, it could continue to rise in the near-term.
The next resistance is near the $10,500 zone and the last swing high. If there are more upsides, the bulls are likely to aim a test of the $12,000 since it is close to the 1.236 Fib extension level of the last major drop from $10,512 to $3,958.
Conversely, Bitcoin might start a downside correction from the $9,500 resistance and the trend line. In that case, the price could test the $8,000 support and the 25 SMA (weekly, orange).
Overall, the bitcoin price is super bullish on the weekly chart, but it’s also facing hurdles near $9,500 and $10,500.

