
Investors and Traders Waiting with Bated Breath for The Launch of US-Based Bakkt Bitcoin and Cryptocurrency Platform
September 16, 2019
Is Bitcoin Still Useful to Circumvent Centralization and Surveillance?
September 17, 2019Can Technical Analysis Capture Bitcoin Price Action?
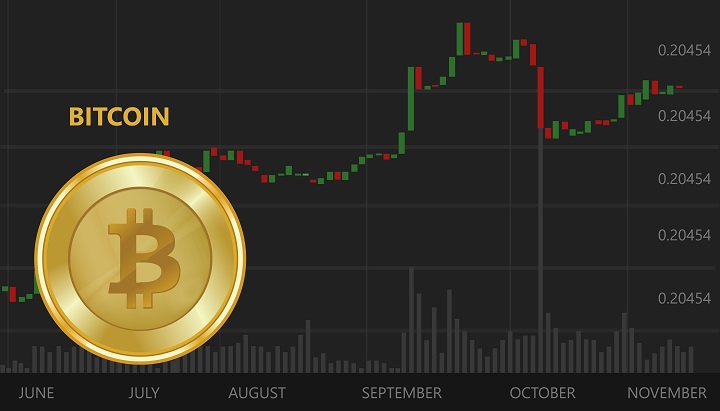
Not many people understand how technical analysis really works. In their heads, it’s simply drawing lines to estimate where the price can go. In reality, however, it is much more than simple symmetry. It involves breaking down behavior and understanding how participants of the market may be thinking. In this article, we’ll explore why the future Bitcoin price can be estimated with chartwork.
How Technicals Work
There is real science behind technical analysis. Contrary to the prevailing view that technical analysis is inaccurate mumbo jumbo, it can be used to break down any and every market. The Bitcoin price is a function of supply and demand, which in turn are functions of behavior.
The core parameters of technical analysis are behavioral structures and liquidity zones. What people often call ‘support and resistance’ are actually just liquidity zones that the majority of the market believe to be prime regions for entering or exiting positions.
When you look at a chart, you may just see candles, but if you look a little deeper, you can see organized market behavior. The way the candles move up and down gives us an outlook about the current sentiment in the market. If Bitcoin is falling and hits a price point where the trend reverses, it means that there are now more buyers who feel that Bitcoin is a steal at this price than there are sellers who think this is a good price to dump coins at.
Breaking it down to its core, technical analysis is actually the study of humans and the way they act collectively. Understanding the psychology and rationale of humans is key because, at the end of the day, a market is a collection of human beings.
A lot of people believe technical analysis works because everyone is looking at it. This is true in a sense, and it captures the innate psychological framework of humans. But, even if traders aren’t looking at a chart, it’s easy to spot sentiment simply by observing humans. Now, since we can’t exactly observe every single market participant in the case of Bitcoin, we have to settle for candlesticks that depict how they’re thinking as an integrated unit.
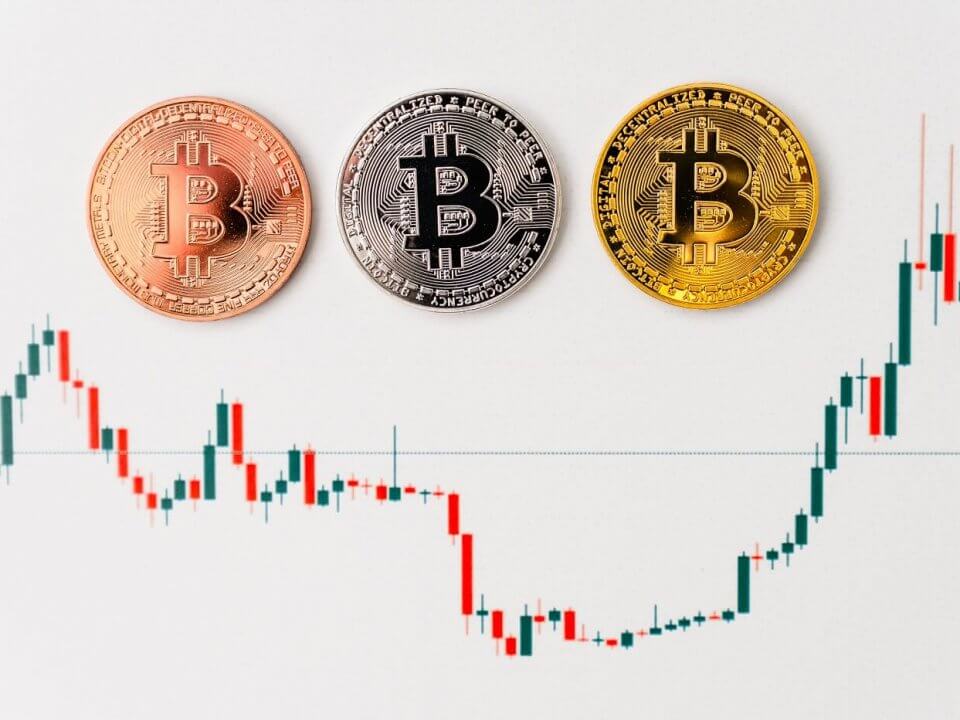
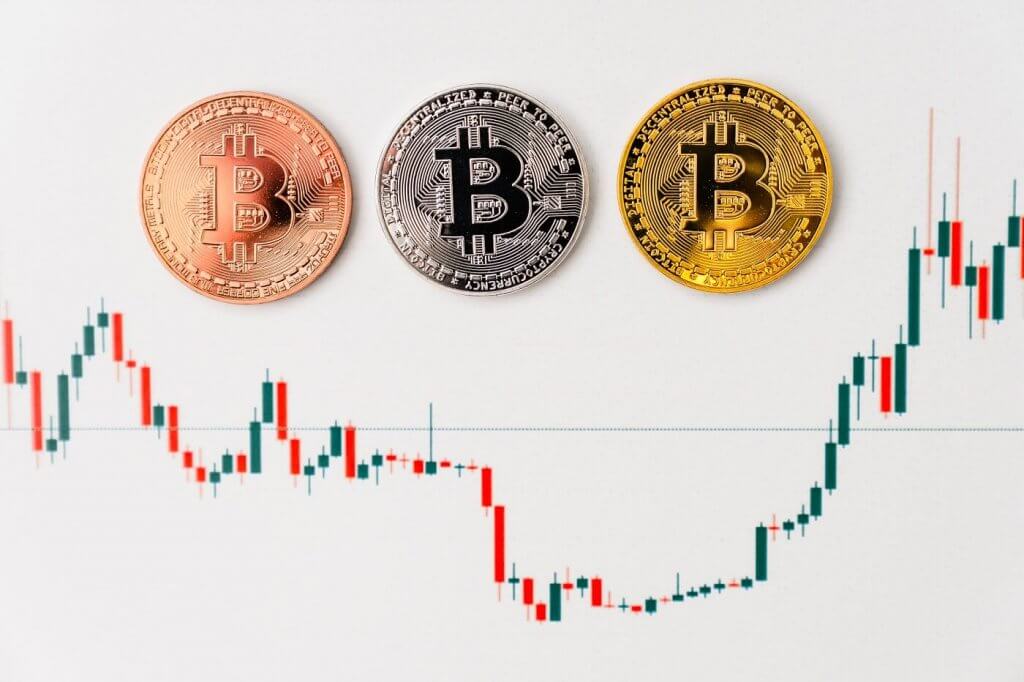
Bitcoin and Technicals
Technical analysis has a rich history, and many market technicians enjoy watching Bitcoin charts. Unlike traditional markets that are riddled with derivatives and regulators, Bitcoin is possibly the freest market, devoid of market-making instruments and agents.
For this reason, the Bitcoin market exhibits much less noise than traditional markets do. Human psychology prevails in the market, and this is because most trading activity is done over spot exchanges. This alone makes it a worthwhile activity to chart and track cryptocurrencies.
With the likes of Bakkt and LedgerX incoming, there is set to be more noise in the crypto market than ever before. This doesn’t reduce the efficacy of technical analysis, it just makes it more difficult to wade through the noise to find substance.
So, in short, technical analysis does help show us where the Bitcoin market is headed. Of course, it doesn’t work with 100% accuracy for anyone because we all perceive what the market is doing in different ways.

