
CME Is Introducing Bitcoin Options on January 13
January 12, 2020
Bitcoin Halving and Efficient Markets: A Theoretical Examination of Supply Crunches
January 13, 2020Crypto Market Analysis Jan 13 – Bitcoin Price, ETH, XRP.
Not much has changed in the cryptocurrency market since the last update. Price is still trending upwards and we think we still aren’t out of this corrective funk, with a potential new low to come. That said, the extremely bearish sentiment we had last week has kind of died down and we can see this pump materializing into something bigger (possibly).
In the last few days, open interest in the derivatives market has been soaring quite dramatically. This coupled with the rejection of support zones sits as strong favorable evidence of a bullish narrative at play.
So with more bullish price action and a very slight uptick in volume relative to the last few weeks, we think the likely scenario is that it is a relief rally that brought all the bored bulls out of hiding, but it will not be the end of sideways action despite having a strong bottom at the moment.
Altcoins are still weak on their own and continue to rely on BTC as a source of strength on the candlesticks. Until altcoins themselves see healthy volumes, it is almost futile trying to chart most of them.
Technical Outlook
BTCUSD
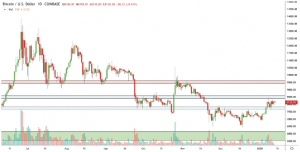
The support zone laid out for Bitcoin (blue box) has been hit and rejected. For a truly bullish incline, we don’t want to see price continuously tapping this support and effectively creating a range. Breaking through the next region of resistance is optimal for BTC to show it truly has the strength to turn this into a meaningful move to the upside.
We estimate resistance will pop up near $9,000 or the early 9,000s. Seeing how the Bitcoin price reacts if BTC ever hits that area will make or break this entire move.
The four-hourly chart structure shows that bullish sentiment is wearing out. Not only is the volume in decline, but price action is possibly depicting a post-pump bull trap scenario. Watching the BTC progress this week is of utmost importance.
ETHUSD
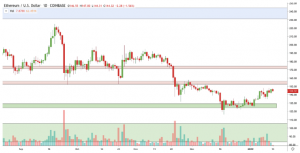
Tapping $152-157 is the absolute end of the line for ETH if BTC doesn’t take out a new resistance. The strong correlation persists and there’s no reason to assume this is going to change anytime soon.
ETH’s price movement degrees are different from BTC due to differences in smaller time frame resistances and supports. However, the bear case is still in play until ETH reclaims its last lower high.
XRPUSD
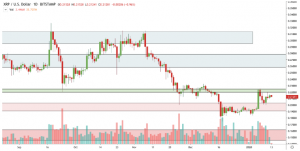
XRP is still moving roughly in line with BTC, but consistent negative correlation implies it can decouple and do its thing at any time.
To reclaim its bullish momentum, XRP needs a daily close above $.214 and two subsequent daily candles closing above $.22. Volume profile is healthy but looks like the majority of the market is leaning bearish, so the bulls will need to break a few sell walls and major resistance at $.225 to have a fighting chance.
Bearish momentum is still definitely in play, and with a relief rally in January, it’s possible for new lows sometime in the next couple of months.
