
Bitcoin Price Analysis 19 Feb: BTC Eyes New 2020 High
February 19, 2020
Bitcoin Price Analysis 20 Feb: What Does the Recent BTC Reversal Mean?
February 20, 2020Crypto Market Analysis Feb 19 – Bitcoin Price, ETH, XRP.
Not much has changed structurally in the last few days, so this will be a chart-heavy analysis looking at how the market has changed in the last few weeks and what can be rationally expected in light of how irrational markets are.
Technical Outlook
BTC Dominance
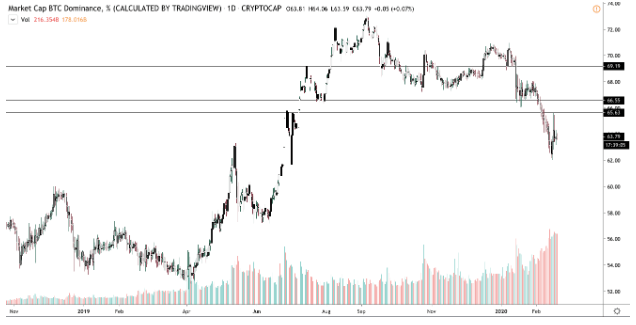
The BTC dominance index is falling at a rapid pace. Over the last few days, it had a bounce upward as altcoins capitulated. However, the macro trend remains intact and it is probably going to continue going down.
Notice the volume here. It means altcoins are legitimately gaining traction. Increasing volume in an uptrend is bullish, but in a downtrend, it is very, very bearish. Since volume has been bursting this entire way down, we can definitely see it breaking the 55-60% mark in the coming weeks. But then again, it’s Bitcoin, so you never really know what random catalyst will send the market flying.
ETH/BTC
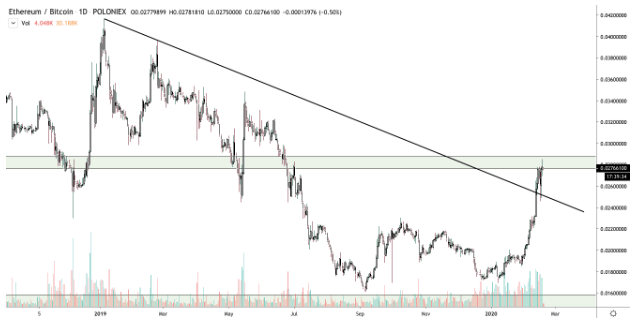
The ultimate altcoin sentiment gauge is definitely ETH/BTC. And the sustained strength we’re seeing here is definitely calling for a bullish reversal of ETH in general.
Since the start of the year, ETH has outperformed BTC and continues to do so by breaking out of a key trendline and coming back to test it as resistance. Volume is strong, trend ranges are being decimated.
We think it’s time to consider Jan 2020 as the beginning of the altcoin season. Altcoins could be on the verge of a massive wealth creation opportunity.
BTC/USD
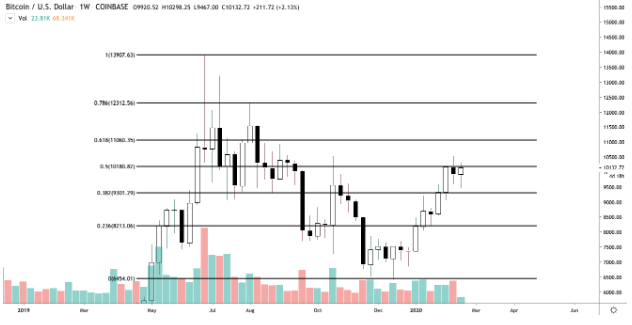
On the weekly, BTC looks like it could see some extra pullback as it is staying put near the 50% Fibonnaci level. The scariest thing here is that the coveted golden ratio has not yet been hit, sitting near $11,000.
We were expecting this move to tap the 61.8% Fibonacci before retracing, but it has happened much quicker as sly traders frontrunned the level. On a higher timeframe, the Bitcoin price still has room to go further down, but we don’t believe that this would result in new lows.
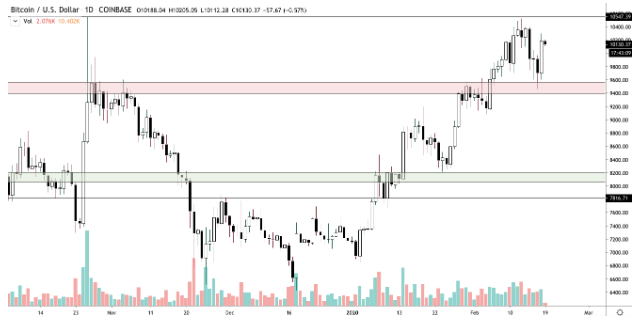
Those in the markets need to be a little extra careful because the daily timeframe just printed a bullish candle. The end of the pullback seems to be on the cards when looking at mid-range timeframes, so one should be cautious in taking indicators without consulting longer timeframes.
The end of the pullback could be upon us, especially with the wick below $9,500 and candle close above the region.
For maximum risk management, one should wait for today’s daily candle to be printed and see if it engulfs yesterday’s candle in a bearish manner, going back into the red zone just below current price.
ETHUSD
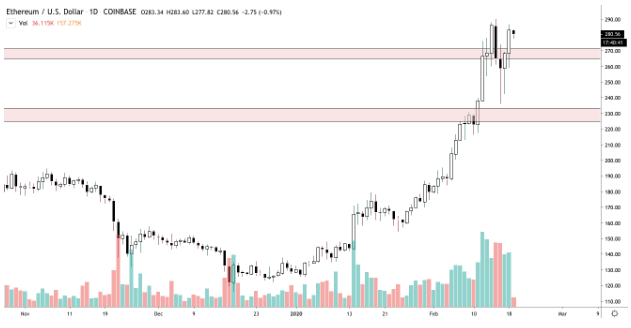
ETH is looking even stronger against USD than BTC, with constant bullish volume and a pathetic pullback, indicating bulls are still in control.
If ETH had hit the $230 mark, I would’ve been a lot more confident in this move. Now it just feels like whale manipulation is moving it past certain goal posts to get people onboard the ETH train.
However, the undeniable bullish action in ETH/BTC is enough for ETH/USD’s set up to be considered bullish.
XRPUSD
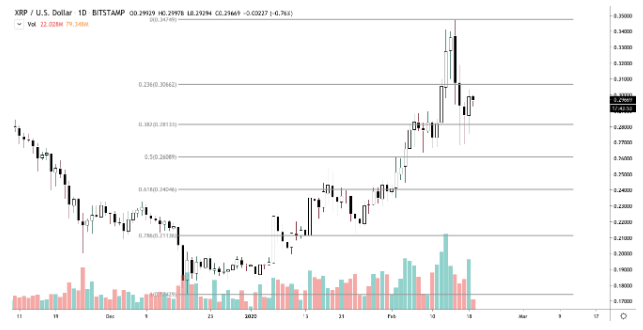
I think XRP will need a few weeks before anything concrete can be said, but the rejection of the 38.2 fib with strong bullish volume is definitely a positive indicator.
I would like to see XRP slowly make it’s way back up to $.35 before actually flipping into a bullish bias.
