
Can China’s CBDC Become the World Reserve Currency?
January 24, 2020
Crypto Market Analysis Jan 27 – Bitcoin Price, ETH, XRP.
January 27, 2020Crypto Market Analysis Jan 24 – Bitcoin Price, ETH, XRP.

In the crypto world, things look as indecisive as ever with a real fight emerging between the bulls and bears. Biases and emotions are running strong in the market, and volatility is taking a step back once again.
Based on data from the derivatives market and our own price action analysis, we still maintain our mid-term bearish outlook, but we also have a counter-thesis in place to spot when things are going against us and switch sides.
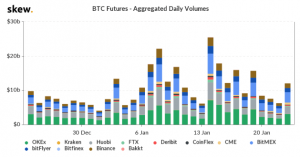
First up, the aggregated futures volume of Bitcoin is moving back down to stagnant market levels. Open interest may be high because people have long-term expectations, but low volume means the interest in the market is dwindling now.
Deribit and OKEx options have been doing relatively well, and they even looked bullish last week. Fast forward to today: everything flipped. 60%+ of options are either calls being sold or puts being bought, which is incredibly bearish. Another little excerpt of data shows us that $8,000 and $10,000 have the highest open interest.
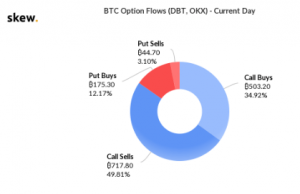
From our understanding, this implies that the Bitcoin price will not go above $10,000 anytime soon, and a move below $8,000 is on the cards. The derivatives market is not a price discovery haven yet, but the sentiment of traders there usually pulls over to the spot market.
Technical Outlook
BTCUSD
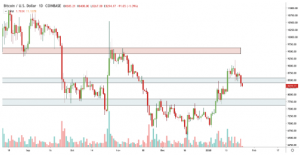
Price just broke through the current floor that has held for about a week or so, but it’s not that big of a deal really. But if it isn’t supported near $7,600-7,700 and the bears continue gaining strength there, it will be a mini bloodbath for BTC.
The volume decrease is still on, but we’re curious to see how a daily move for the bulls with sustained traction would look like. We suspect it will still have low volume as overall sentiment remains at a neutral level.
Adding to the misery of bulls comes the Fibonacci retracement.
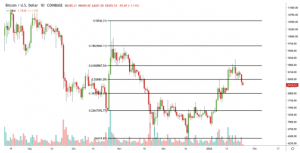
A pinpoint smack of the 61.8% fib from the China rally to the bottom indicates all of this was just a retracement to take some pressure off the sellers. Most likely scenario: the downturn continues; we break $6,000.
But as we said earlier, holding up $7,600-7,700 will reinforce a bullish scenario and indicate the potential for new highs. In this case, we would like to look at updated derivatives data before taking a conclusive call.
ETHUSD
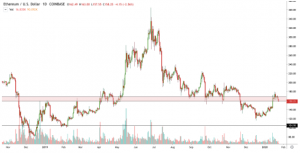
ETH currently reeks of an S/R flip. The pink box is a very strong liquidity zone that held as major support for ETH during 2019 after being flipped as a resistance.
The same thing is in danger of happening again, so we believe it is truly a decisive moment for ETH. If that level gets rejected as a resistance, fresh lows are definitely on the cards.
However, given it is still above the level, testing it as support, this can also be a strong indication for bullish momentum. Now is just the time to observe this potential S/R flip.
XRPUSD
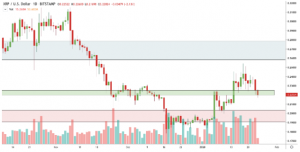
XRP is also in an observational zone. We have no notable comments regarding price actions and decided to share this chart just so you know the key levels we’re looking at.
