
Poll Reveals 23% of Bitcoin HODLers Will Never Sell
November 4, 2019
London-based Cryptocurrency Exchange Luno Gets Approval From Malaysian Regulator
November 4, 2019Crypto Market Analysis 4th Nov. – Bitcoin Price, ETH, XRP

Another quiet week in the crypto market, but this was much expected after the monstrous rally we saw last week. There has been a lot happening in and around the crypto market in the last few weeks and these developments are expected to have a major impact on the market.
One instance is the announcement of Bakkt options. In case you haven’t heard, the hype machine that is Bakkt has decided to launch physically settled options contracts as well. This is great news for miners and institutional investors as it gives them a cheaper way of hedging their positions with increased precision.
BitMex leaked its customer’s email addresses. Incredibly poor operational security measures from within have led to this, and there is absolutely no excuse for being so irresponsible and careless. This hasn’t affected their volume in the slightest, although it could as there are now dedicated hacker groups trying to brute force people’s email IDs. If you don’t have 2FA enabled on your BitMex, do it right now. Like right now.
On the more technical side, we have seen volume growth fall exponentially from that one huge daily reading on Oct 26. Quite sad, as this means we are likely in for some dump and chop before getting to look at where BTC et al are in the grand scheme of things. As of now, we are leaning towards the narrative that the BTC bottom is in and we are experiencing the usual ‘wave 1’ chop.
Altcoins, on the other hand, are looking quite bearish with their smaller price boom and near dead volumes. Even LINK, possibly the best performing asset of 2019, is starting to look a bit bearish as it gets cluttered and wicked into a very strong liquidity zone.
Technical Outlook
BTCUSD
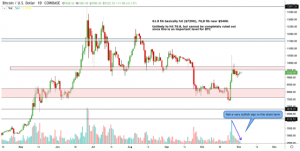
The first thing that hits us with this BTC chart is the lack of volume after the single day explosion. If you remove that one day, it paints a bearish picture of continuous falling volume. But even in that scenario, volume decrease in a bearish market is a bullish sign.
$9,520 will act as a point of resistance, and we believe another hit of this will warrant a sub $9,000 BTC price. Our personal bias at this point is a hit of the low $8,000s from where volume will recover and BTC will move towards $12,000. At the moment, there isn’t much to contradict this thesis, but it’s important to be able to switch biases in an instant as new information comes in.
A 4-hour candle-close below $9,150 will be an indication of more downside to come, as this has been an outstanding level of support over the last week. It will be interesting to see how the volume profile looks once there is a significant move downward.
Looking at the XBTUSD order book via TickTrades, the majority of orders are packed on the sell-side at the moment. On lower time frames, BTC very bearish for the short term.
ETHUSD
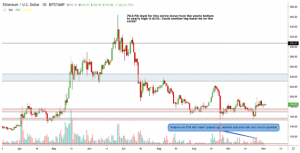
ETH volume hasn’t been significant on either side since it hit the $152 bottom. And despite volume preceding price, it wasn’t able to break this support on the next leg down. Instead, this support region facilitated a double bottom and allowed ETH to appreciate by around 30 percent.
The 78.6 Fibonacci level for the entire move from $81 to $360 is near $142. Could this indicate another leg down for ETH? Well, maybe. It’s difficult to estimate this when the volume is so pathetic, but it definitely cannot be ruled out.
If ETH manages a weekly close above $175, I think there is scope for a move to the mid $200s. However, a close below would bring us a step closer to sub $150 ETH. To us, all these regions lying below current price action are accumulation zones. The value proposition that Ethereum is creating and the impending launch of ETH 2.0 are going to bring a whole new level of efficiency, usage, and utility to the network.
Long term, we see ETH as the best play in terms of risk-reward, but it still has much more absolute risk than BTC, so be cautioned with it.
XRPUSD
1,000,000 XRP released from escrow this week; you know what that means (XRP dump time). Everybody is calling this the “Swell pump” that happens every year near the XRP Swell conference.
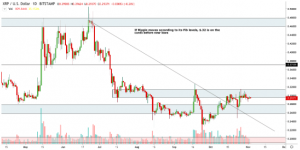
If the weekly candle, which closes on Nov 4, closes below $.295, we expect XRP to move down toward $.25. Higher time frames set the trend, lower time frames offer swing opportunities in that trend. However, if the Swell narrative plays out, $.32 may offer some resistance that can be upheld. A break of this would mean an inevitable hit near the $.37 area.
Ripple Inc is being a bit more diligent with their XRP sales in the open market. The reduction in their quarterly sales numbers has led to an appreciation in XRP price instead of the continuous descending triangles, although this could also be a part of the triangle.
XRP closing above the blue box it is currently in is a very bullish sign to us. If it can stay above this with a healthy volume, we would have to reevaluate price action from scratch.
