
Developers Are the Real Backbone of Bitcoin, Not Miners
December 27, 2019
Cashaa Reduces Service Fee Significantly As Business Volume Soars
December 28, 2019Bitcoin Price Analysis: Could BTC/USD Close at $7,600 This Year?

Ever since the Bitcoin price peaked on June 26, the BTC/USD pair has been unable to shake off the bears and has been on a downward slope ever since, with a swing high recorded on October 26 near the $10,300 mark.
However, the bears have been in total control in the last 3 months, with BTC even dropping to the mid-$6,000s before staying stagnant in the low-$7,000s.
The last week has seen the premier cryptocurrency momentarily touch highs of $7,600 and $7,400 only to drop down to the ever-so-familiar support at $7,120.
Resistance at $7,300 kept the Bitcoin price down in the last 2 days, and it finally touched an 8-day low of $7,050 yesterday. However, trading on Saturday has been positive.
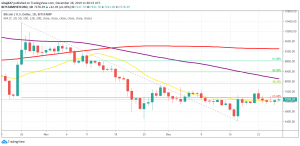
On the daily chart above, we can see that Bitcoin has gained and is trading near the $7,280 mark at the time of writing. The 23.6% Fib retracement of the drop from $10,300 to $6,500 (October 26 – December 18) lies near the $7,350 mark and could prove to be tough resistance for the pair.
Additionally, the 38.2% Fib retracement of the drop from $10,300 to $6,500 lies near the $7,800 mark and it could be even tougher for the price to break above that. Meanwhile, initial support lies at the 20-day MA of $7,200.
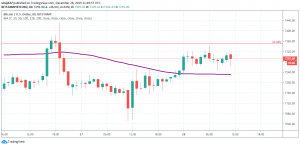
Meanwhile, on the hourly chart, we saw yesterday that Bitcoin had moved below the SMA100, but today, it had substantially moved above the SMA100 which is a slightly positive sign, but a break above the $7,350 resistance is necessary to see a possible rise to $7,600 before the year ends. With only 3 days to go, are the bulls ready to make it happen?

