
Bitpay COO – Bitcoin Price to Reach $20,000 in 2020
January 16, 2020
Bitcoin As a Political Movement
January 18, 2020Crypto Market Analysis Jan 17 – Bitcoin Price, ETH, XRP

The volume profile on the current move looks excitingly bullish. Usually, volume precedes price and is a tell-all as to what sentiment looks like at the moment. That’s why, despite many bearish signs and our own personal bearish bias, we cannot rule out the bullish case at the moment.
In a previous update, there was a trendline that held up the Bitcoin price and served as a base for this explosive move up. That trendline coincided nearly perfectly with the 61.8% Fib retracement level.
Derivatives have been at the center of market structure in this run. Despite the spot market still being king, the options market is genuinely gaining a lot of traction, with futures and perps already significantly traded markets.
Deribit options volume suddenly spiked up on Jan. 14. This was the largest trading session for derivatives since the Oct. China pump. Going off open interest, it seems that a chunk of that volume was either directed to the Jan. 31 expiry contracts or Mar. 2020.
Considering Mar. 2020 has been the dominant contract for a while, we think it’s possible somebody opened a large position for a short-term trade in the Jan. contract. The break up of contracts entered implies it is most likely a long trade (buy calls or sell puts).
Indicators all look slightly bearish, and we’ll dig a little bit into that now. As usual, we aren’t very concerned with altcoin outlook at this point considering market conditions.
Technical and Sentiment Analysis
BTCUSD
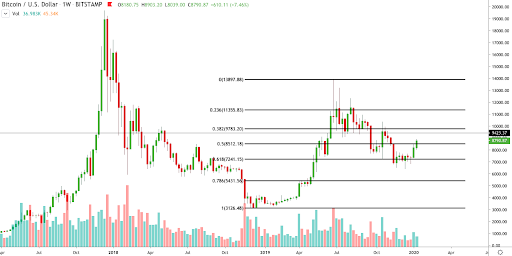
A quick look at the weekly chart and we see that the 61.8% Fib retracement has held really, really well for Bitcoin. But considering the indecision in that region, we figure another leg to the $7,200s will send us spiraling downwards.
Fun fact: the move to $13,900 was a near-perfect wick of the 61.8% Fib of the entire bear market from the $19,000s to $3,120. That alone should be a testament to the strength of the 61.8 fib%, but constant indecisiveness there pushes the price down.
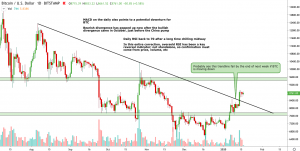
On the daily chart, there is still a very strong chance of bullish momentum showing up due to the sudden increase in volume. But when looking at volume also, one should realize that over the midterm, from Oct. 2019 – Jan. 2020, volume is on a decreasing trend. So this current uptick is ruled out, and the bear thesis is still in control.
RSI on the daily finally hit oversold levels. This, in particular, was a great reversal indicator during the descending move we have been in since June 2019.
The current trendline that has formed may be taken out or rejected. We suspect that we will reject it and head down by the end of the next week. Trendline confirmation for us is two weekly candles closing above the trendline.
ETHUSD
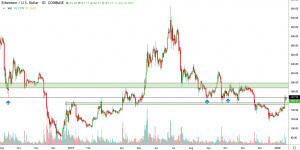
In the above chart, there are 3 arrows on ETH. Each of them shows a touch for a particular point of support. Why have I highlighted some random support zone? Well, it falls in line with a strong liquidity zone that could be a massive barrier for ETH.
Support turned resistance is a very common phenomenon. Given the longevity of this support zone and current price finding it difficult to thrust above, $167 could become resistance here and push ETH way downward.
We personally feel like ETH has been beaten down enough and demand must be flowing back in, but nothing can be ruled out due to high correlation to BTC.
XRPUSD
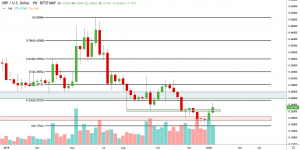
We’re going a little long term for XRP today.
Usually, XRP retracements hit the 38.2 or 23.6 fib levels. At the earliest, we can expect a reversal near $.25, or at the latest near $.30.
This might take a few weeks (or less) to play out, but it will build a strong investment thesis for short term moves in XRP.

